Databricks Cost management
⚠️ This article was published alongside a talk we gave at a Databricks meetup, where we were invited to share insights on how we manage our costs effectively
While the title of this blog post is self-explanatory, I will clarify that we will not be discussing code optimization.
Costs can certainly be linked to performance (such as model implementation and storage optimization), this subject is broad enough to warrant separate articles.
But this article will cover most of the best practices regarding handling and managing Databricks costs. One topic after the other.
A little bit of context
Every company has unique insights into their spending, particularly on cloud platforms, and Databricks is no exception.
But I prefer to be, once again, clear about how we used Databricks at Jolimoi :
- We have a limited budget and this includes R&D projects 👀
- As a startup, we cannot afford to waste resources without justification. Our budget is based on a fixed % but always adjusted every month regarding the past turnover, which means no cushion at all
- We mainly used Databricks for ETL and warehousing purpose
pip install dbt-databricks😇- We are an AWS shop
- We’re not managing petas
Understanding of the cost structure
It seems obvious, but let's begin by understanding the components of our expenses. And for that we can refer to some good references including :
- Public Prices
- Pricing Calculator
- Databricks Documentation on Cost Optimization
- Best Practices for Cost Management
- Account Settings and Usage
Unlike some solutions, Databricks prices seems to be more complex. Mostly because it’s composed of two parts :
- Cloud costs (for us AWS) so : mostly data transfer, compute and storage
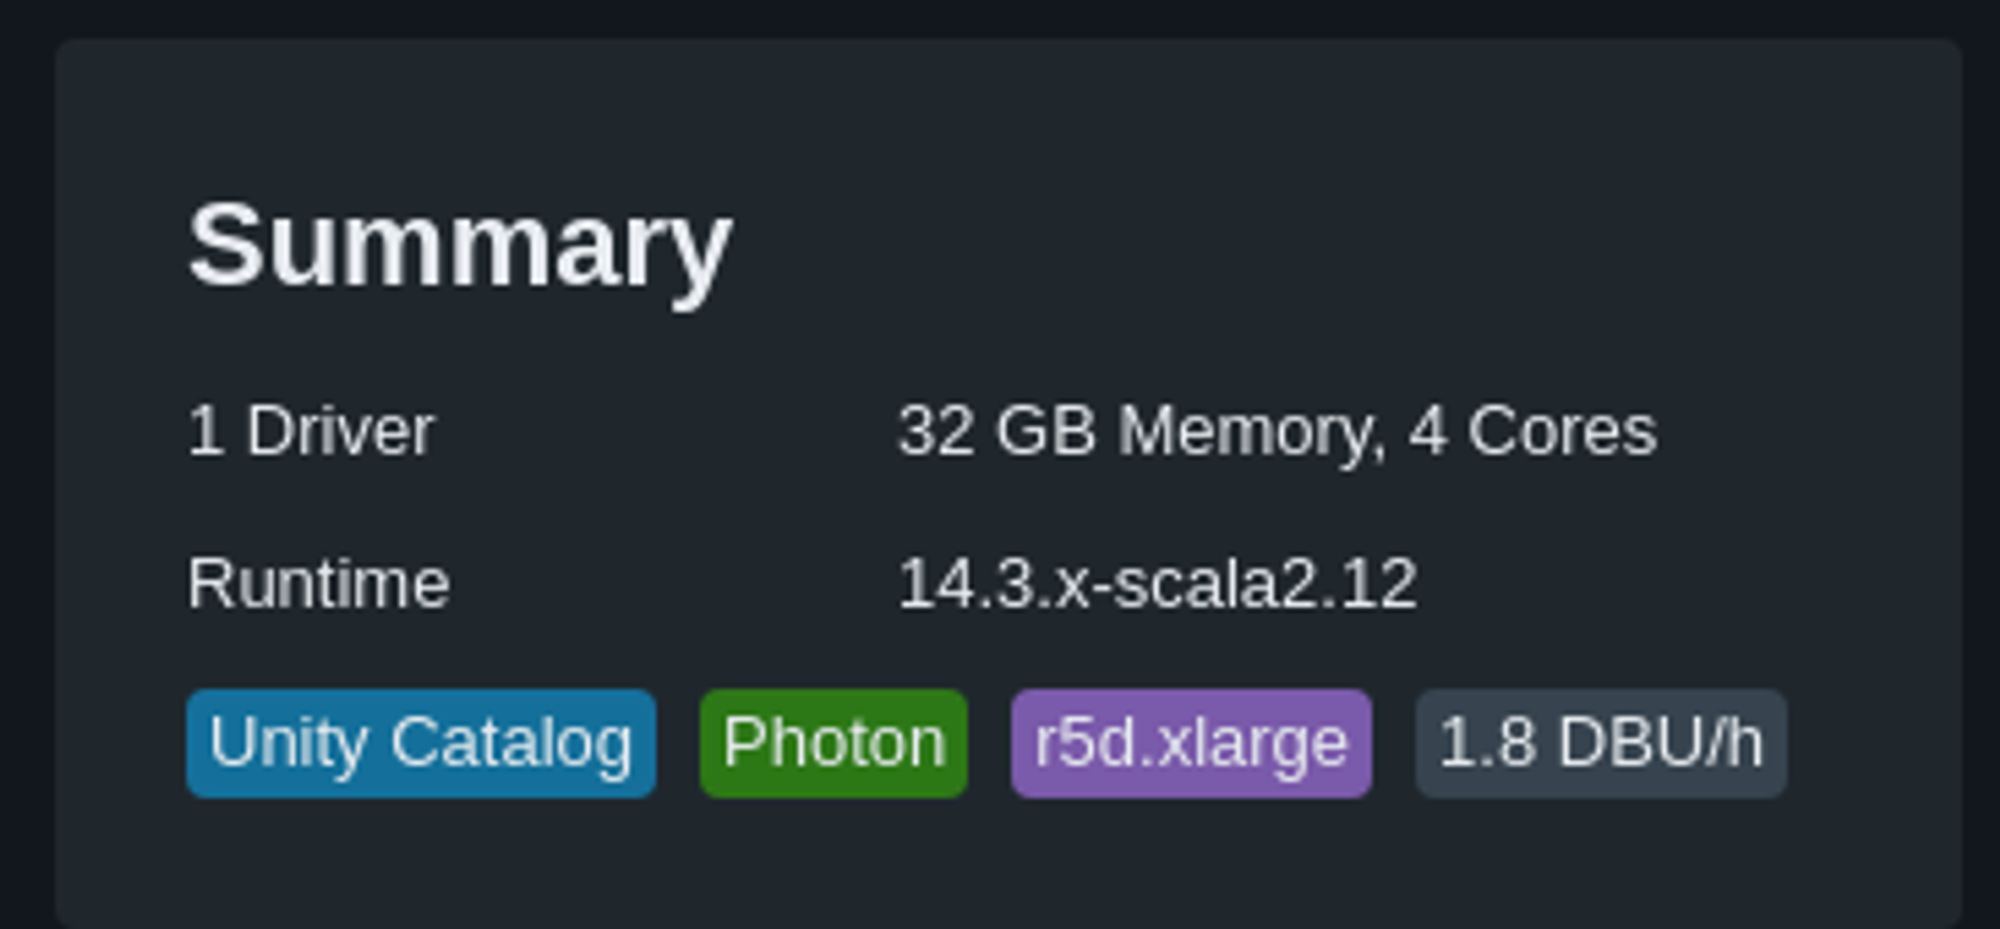
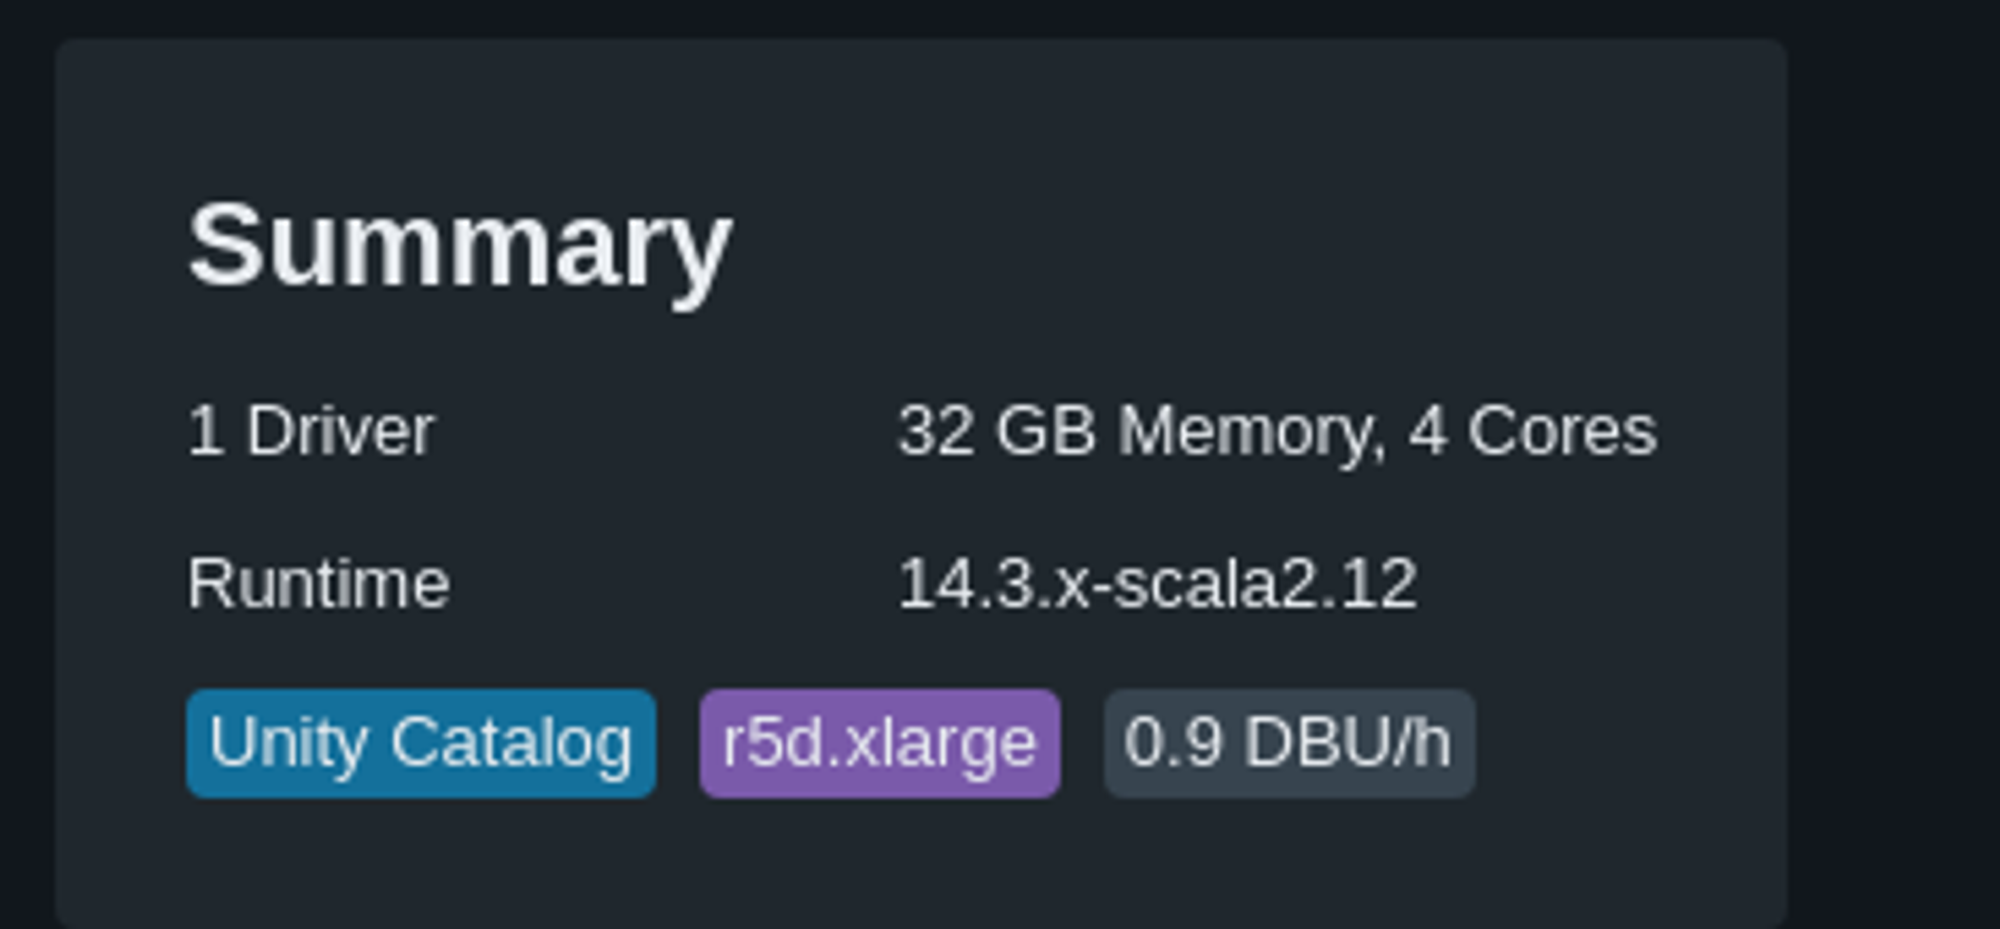
- Databricks usage kind-of-licence aka DBU (DataBricks Units). This cost mostly follow the compute you put in front of it (the bigger the cluster/server/… the bigger you pay). It’s a cost per time consumed (per-second to be more precise)
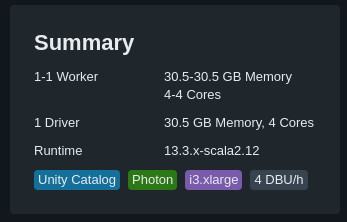
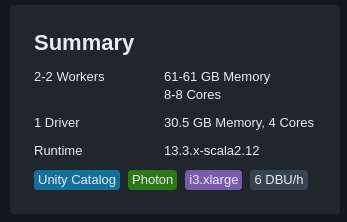
You can have a clear correlation between the number of instances and the DBU consumed (in this example, 1 instance = 2 DBU/h)
Monitor what you pay (and tag)
Now that you know how the bill will be split...
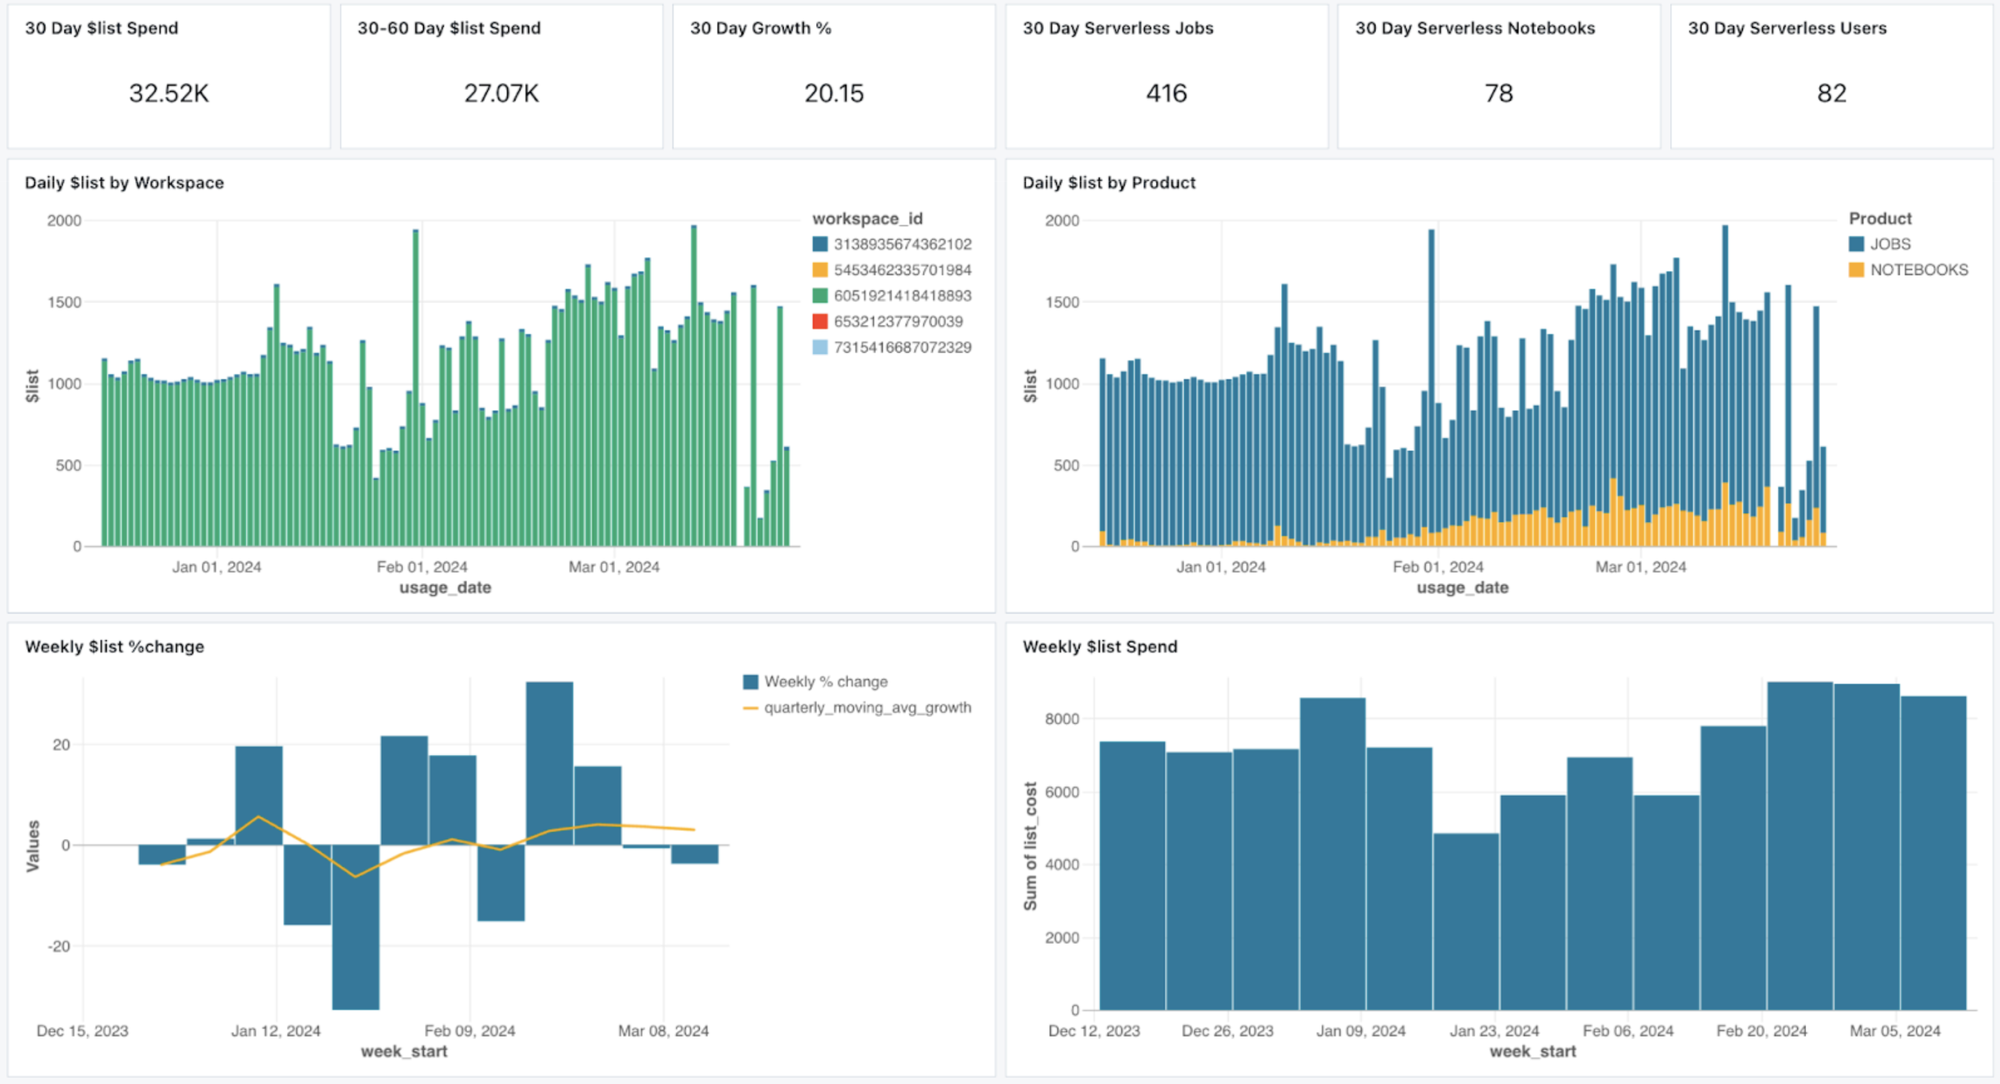
For doing this you have multiple options, but the first one you will used is maybe the account console. She allow you to filter your data usage using various graphs. This filter can be done on : SKU, workspace and tags.
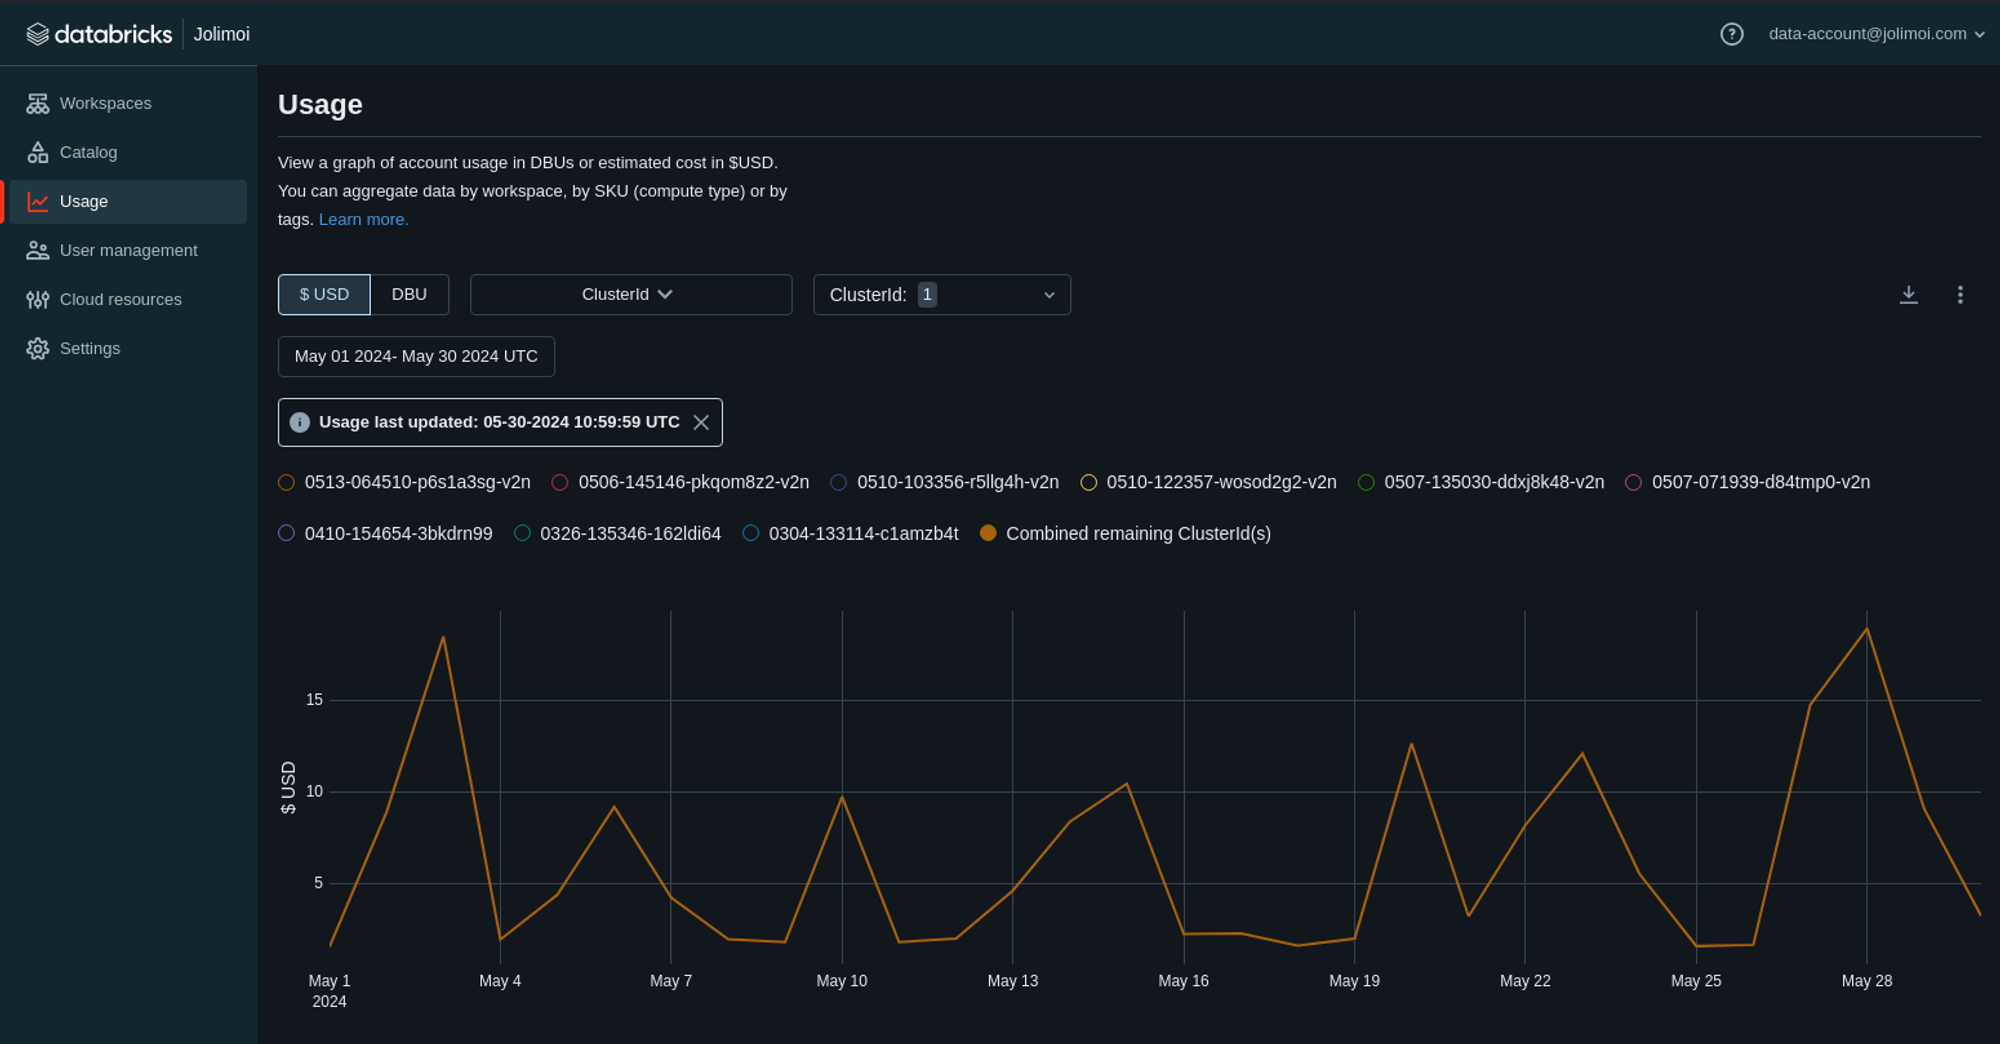
While this may not provide precise cost analysis, it is effective initially if your tags are well configured. Because yes, tags is a classical but still relevant best practice regarding FinOps and cost monitor .
In Databricks some tags are set up by design. But you can also your own tags convention. At Jolimoi all our cloud assets (including Databricks, except endpoints since they didn’t allow colons) are setup with the following tag :
| Tag | What it means? |
|---|---|
| jm:application | This is the very basic. Call it feature or something else like project, it’s the key identifier regarding the usage of this asset |
| jm:domain | Can a division a team or just a business domain (marketing, data and so on) |
| jm:role | Example : front, back, security, ETL, data science |
| jm:environment | Production, Integration, Staging, Sandbox … |
| jm:owner | Key stakeholder, project owner, analyst or even a technical contact. In fact whatever you need to identify who is in charge of this asset in term of billing |
| jm:managedBy | Mainly to identify how this asset was build. In our case it can be Terraform, CloudFormation or just nothing, which means it was done by hand |
| jm:taggingVersion | Even tagging convention can have versions 😄 |
This tags aren’t only interesting to understand who used what (and having some more readable information than a cluster ID). These tags are practical for applying show-back and charge-back strategies to other business entities, especially if the IT budget is distributed across the company.
And to talk again about data usage, they are available via multiple ways :
- API
- S3 delivery (preview)
- System tables (preview also, see below)
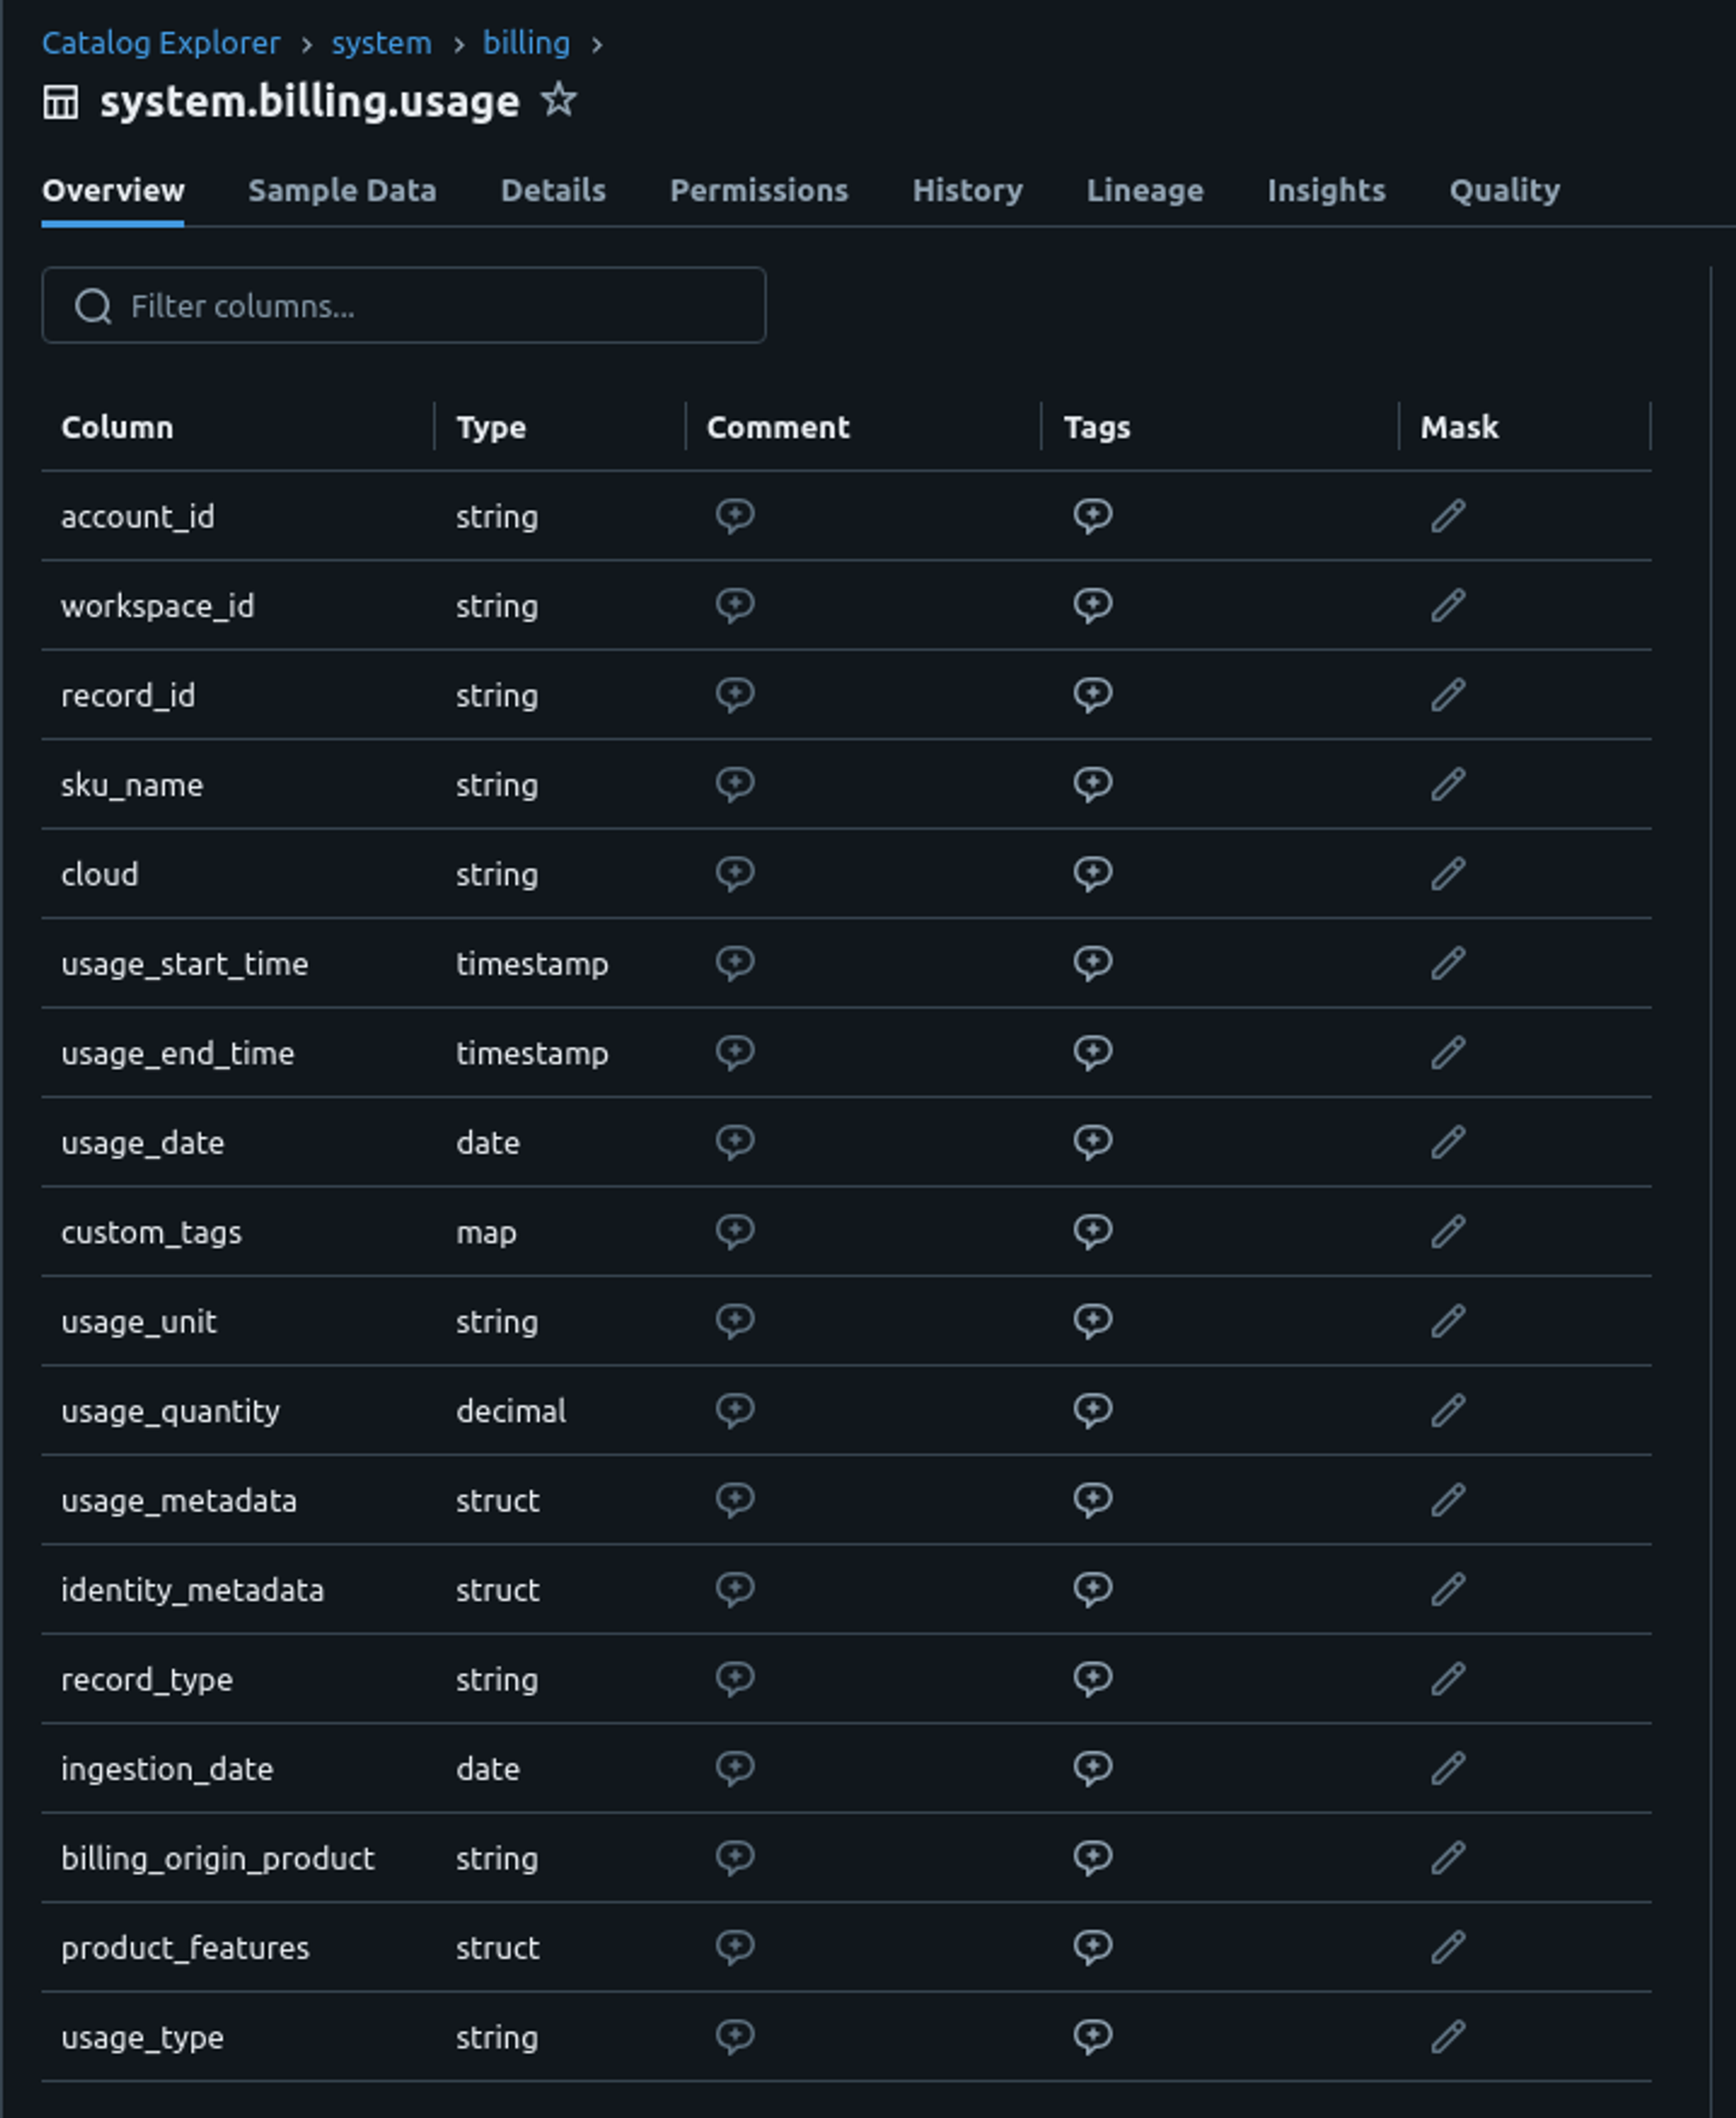
system.billing.usage
And so speaking about this last one, if you want to foster this data more accurately you need to used system tables.
The system tables include:
system.billing.usage: Usage datasystem.billing.list_prices: Pricing data for Databricks SKUs at precise times
If you want to play with this tables Databricks give you a list of queries examples and templates.
However, you might prefer to create your own query, such as this one:
SELECT
  billing_origin_product
  , usage_date
  , usage.sku_name
  , COUNT(usage_quantity) as dbu_count
  , CAST(pricing["default"] AS FLOAT) as pricing
  , (dbu_count * CAST(pricing["default"] AS FLOAT)) as total_price
  , custom_tags["jm:application"] as application
FROM system.billing.usage
INNER JOIN system.billing.list_prices on usage.cloud = list_prices.cloud
  and usage.sku_name = list_prices.sku_name
  and usage.usage_start_time >= list_prices.price_start_time
  and (
    usage.usage_end_time <= list_prices.price_end_time
    or list_prices.price_end_time is null
    )
GROUP BY
  billing_origin_product
  , usage_date
  , usage.sku_name
  , pricing["default"]
  , custom_tags["jm:application"]
ORDER BY
  usage_date DESC
  , dbu_count DESC;
Or also the cost observability dashboard available on Github (not really working well, and in fact why not putting this in the sample gallery? 😄).
Optimize your compute
So now let’s jump to the compute topic and what can done on Cloud side. Since every option can be related to your specific use cases, I will mainly focus on some global guidance regarding this big topic.
The first idea is definitely to evaluate instance types and families. For that Databricks help you through the interface and the possibilities are wide :
- Optimized for storage, memory, general purpose, with GPU
- With or without Delta cache accelerated (Databricks Runtime 14.2 and above, the
CACHE SELECTcommand is ignored)
For instance family let’s sum up it :

If you ask about what EC2 instance refer, the AWS console is always a good start to compare instances:
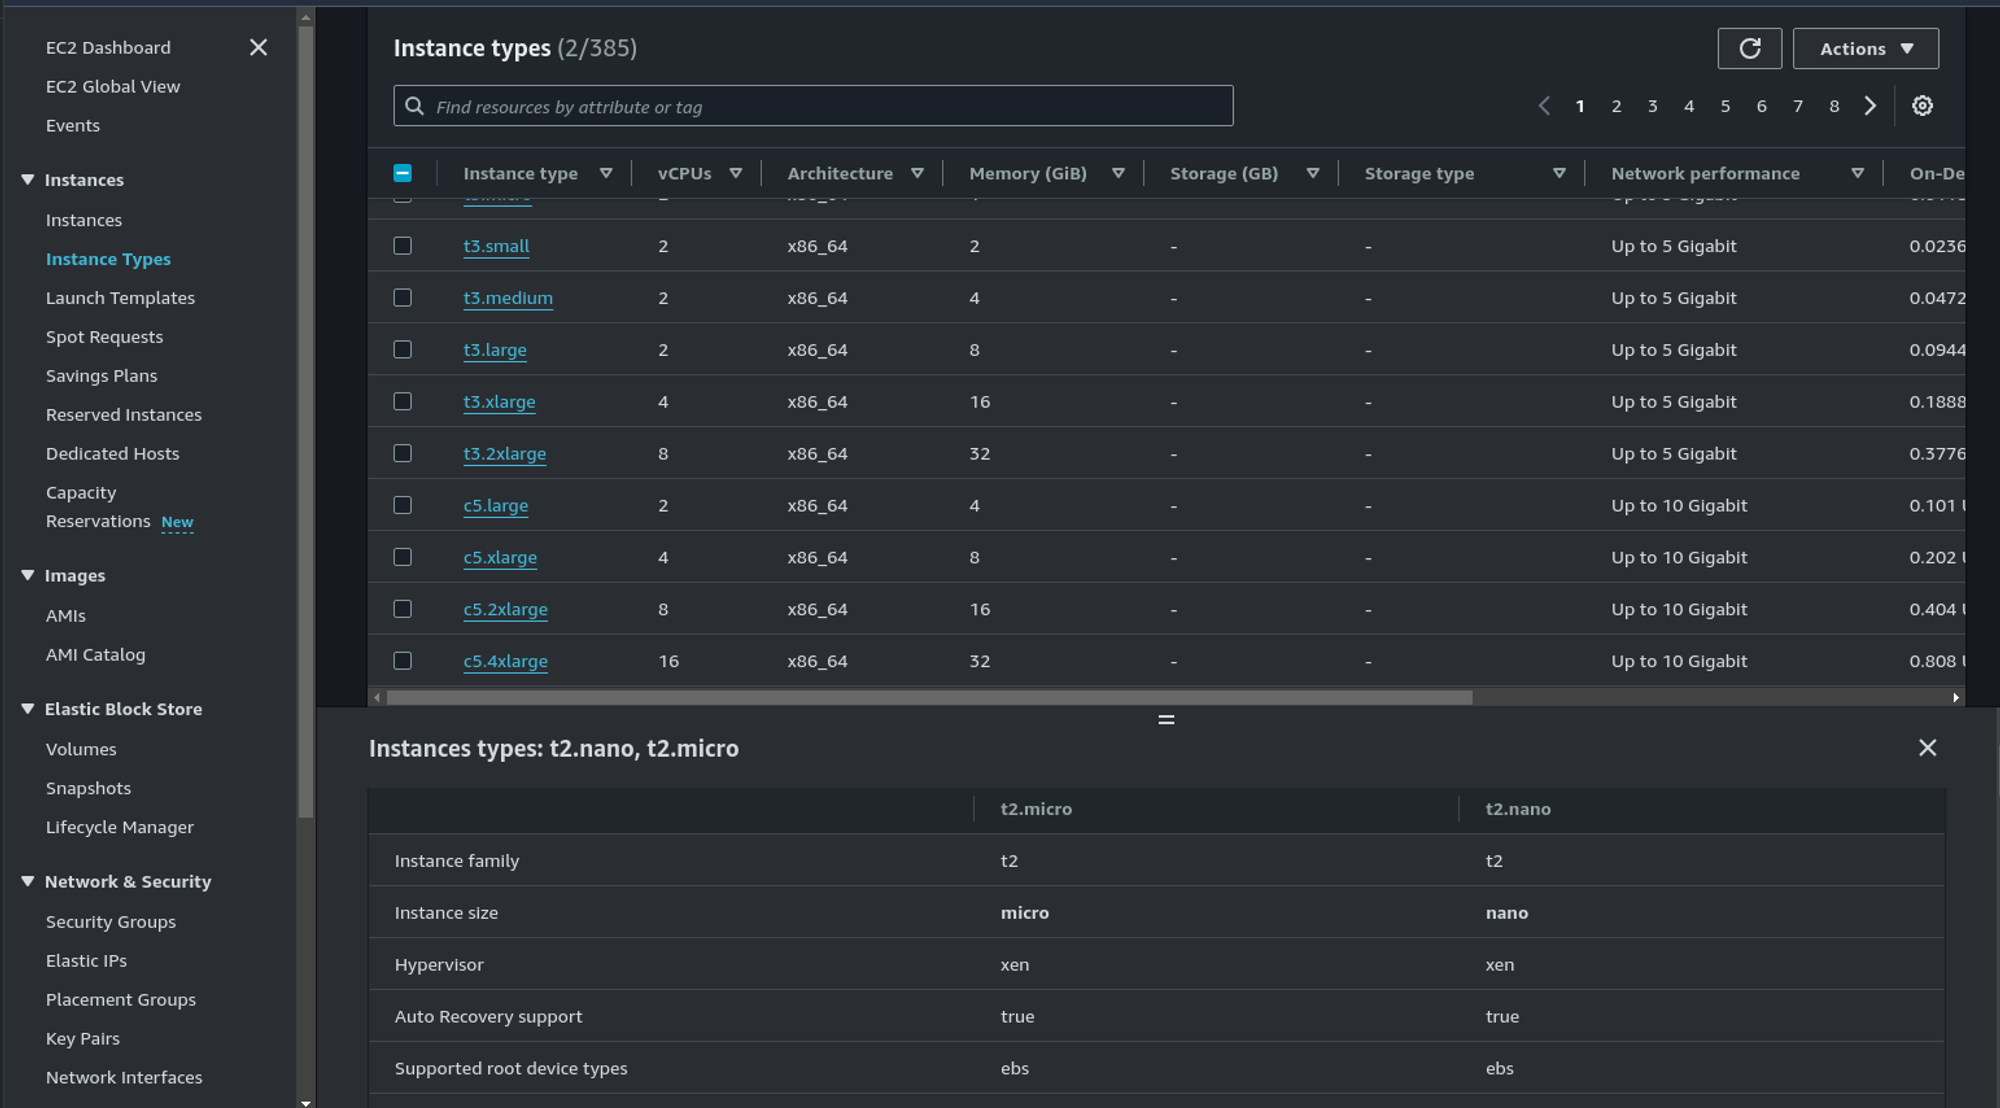
And if you also asked what are all this letters, you can find a quick explanation in this article.

Apart of general considerations, the best advise is monitor your workload and see how to internals of the cluster (memory and CPU) react to it. Same for the driver node sizing.
For the Delta cache as explain before, if you're using the more recent runtime it's not something you need to look especially. And by the way, picking the latest runtime always seems to come with some good news regarding performances (but always check if your code run on it for sure).
Also, be careful about Graviton instances they didn’t support some features.
Leverage Cloud capabilities
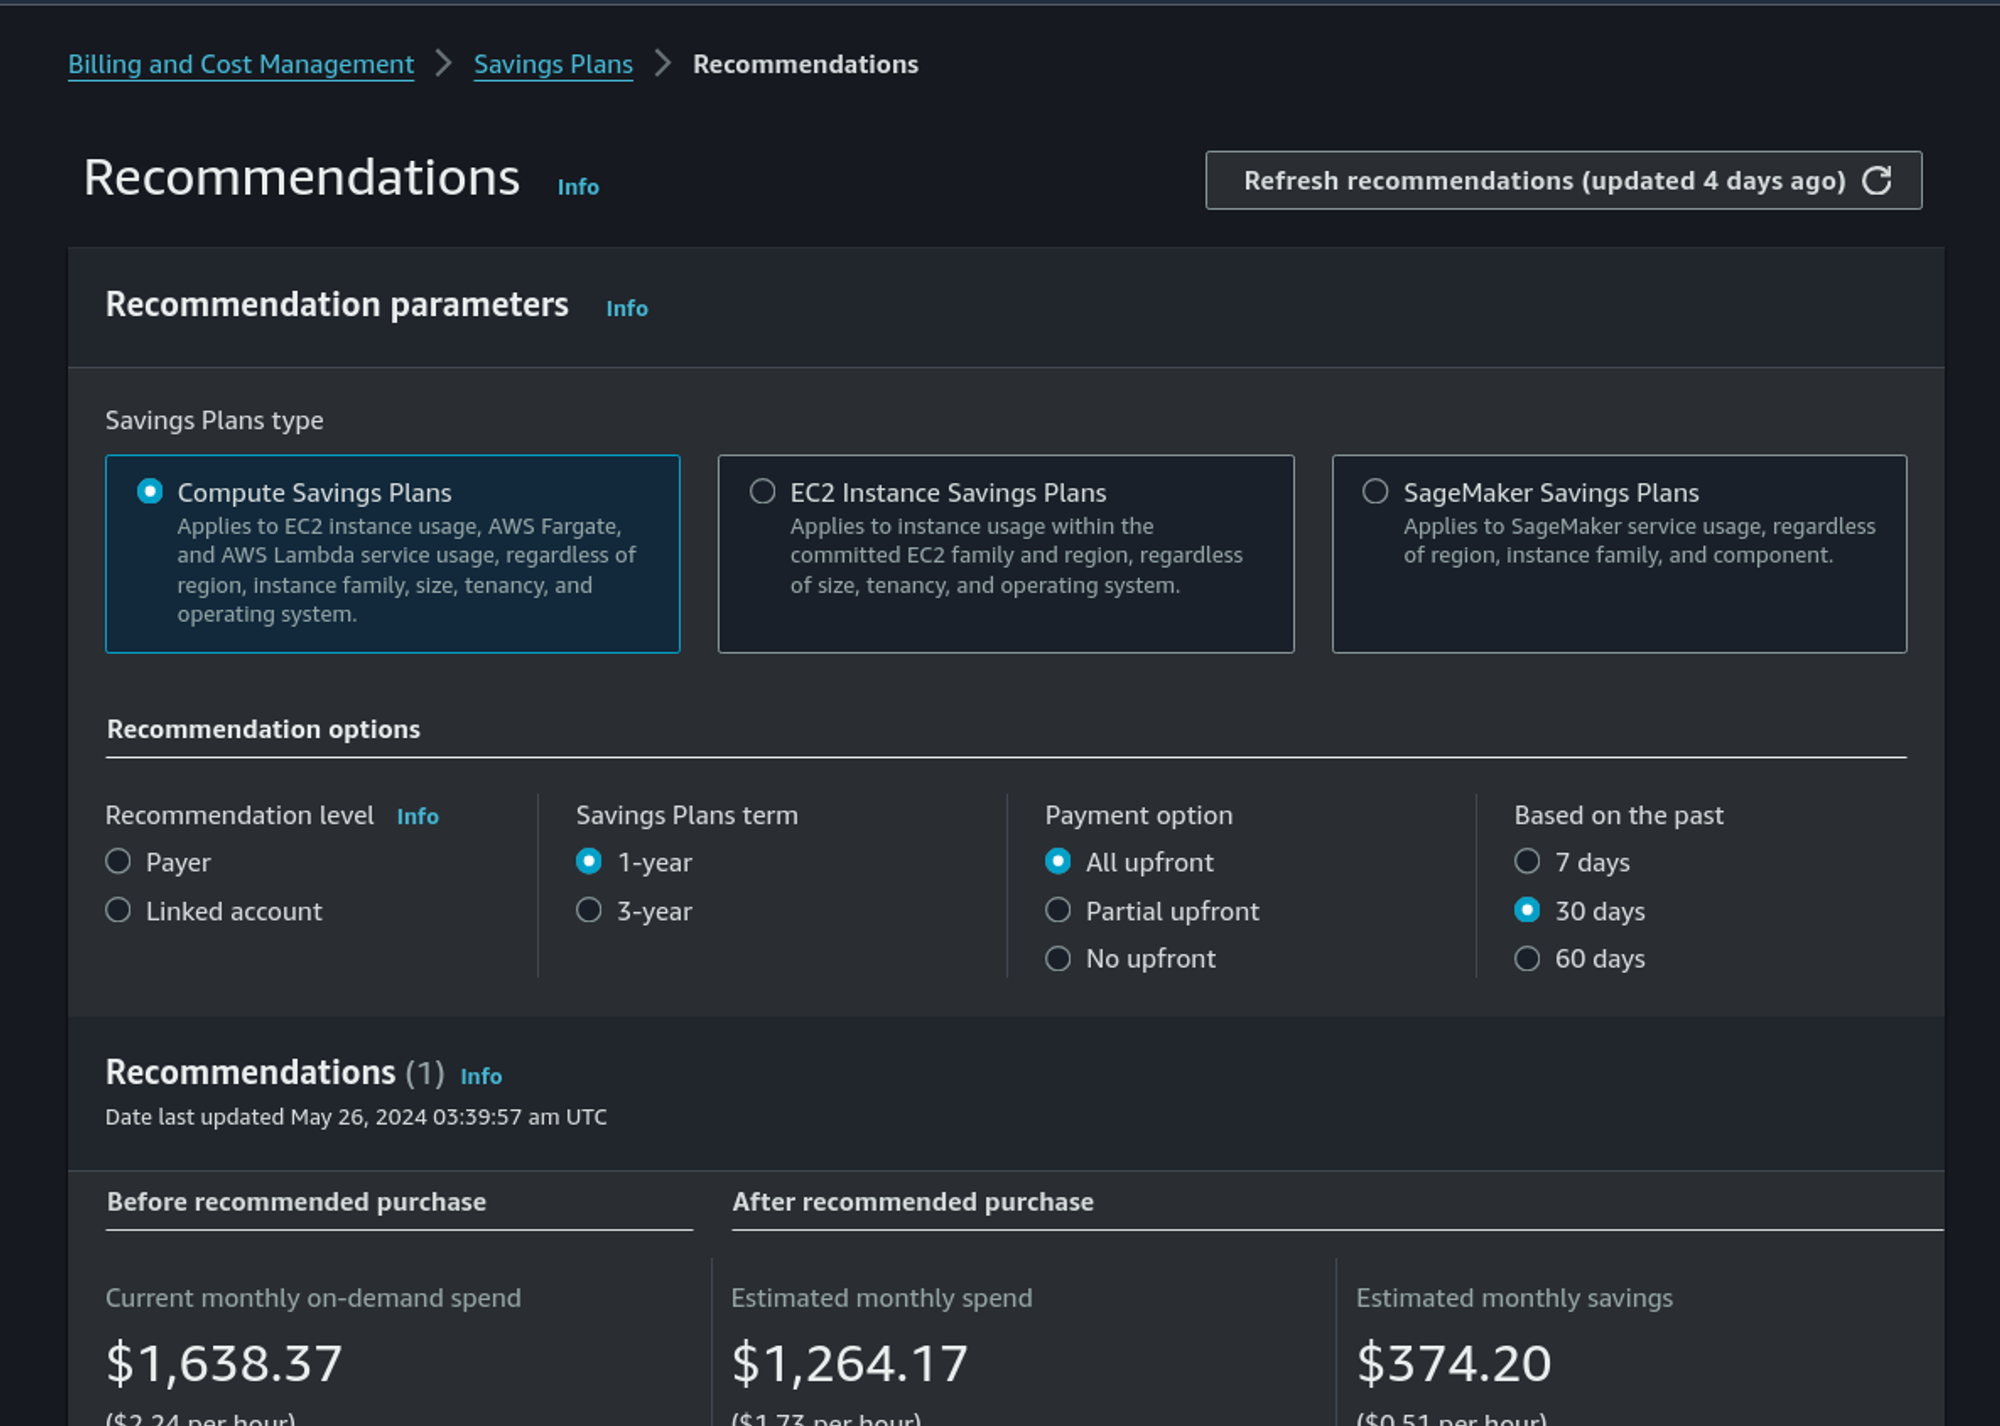
Not related to Databricks but Cloud provider also offer specific capabilities in order to optimize your bills. In AWS it can be discount with Saving Plans (more flexible with bigger discount) and Reserved Instances (not the best option).
It’s just a engagement for you in regard of AWS : you engage your consumption on a family and in regard of that, AWS will give you a discount. And it’s bigger if you pay a part or the total in advance (upfront).
AWS propose some automatic recommendations based on your past consumption. It’s a good start regarding this:
Photon or not Photon?
Last but not least, as define by Databricks, Photon can be see as something cost effective.
Photon is a high-performance Databricks-native vectorized query engine that runs your SQL workloads and DataFrame API calls faster to reduce your total cost per workload.
For sure Photon is maybe for you a no-brainer when your goal is to go quicker like using a Job cluster and made your results go faster before termination. But did you do really the math?
Because by default, Photon means paying twice the price. It's as simple as it is. But is Photon reduce your time per 2 also ?
(Not yet a) Conclusion
This concludes our discussion on Databricks cost management. We can imagine cover in a future article topics such as job and cluster configuration, auto-termination, pool clusters, fleet and spot instances, and SQL warehouses.